Wayfinding (2016)
glass, steel, bungee cables, electronics, high-gloss paint
In his seminal work The Image of the City, Kevin Lynch coined the term “wayfinding”, which describes the process of using spatial and environmental information to orient oneself and navigate to a destination. Lynch elaborated to define four unique stages in this process: orientation (the establishment of one’s location relative to nearby objects and a destination), route decision (the selection of a route to get to the destination), route monitoring (checking to ensure the route is heading toward the destination) and destination recognition (acknowledgement of arriving at the destination). Throughout history, many approaches have been used to accomplish the four stages of wayfinding, everything from maps to GPS coordinates, and one of the most powerful devices and symbols has been the compass.
While we have all experienced wayfinding and its four stages in a spatial sense, how does this principle analogize to the path one chooses in life, and its potential ever-changing influences by society? Furthermore, how does the notion of wayfinding evolve and morph as our sense of destination is largely unknown and ultimately impacted by the people we meet and their subsequent aggregate of chosen paths? By abstractly paying homage to the design principle of wayfinding coupled with the theme of metamorphosis, this responsive installation serves as a metaphoric representation of an electro-mechanical compass that seeks to reflect on the paths one chooses in life, the individual and societal offshoots and the subsequent periods of chaos and harmony.
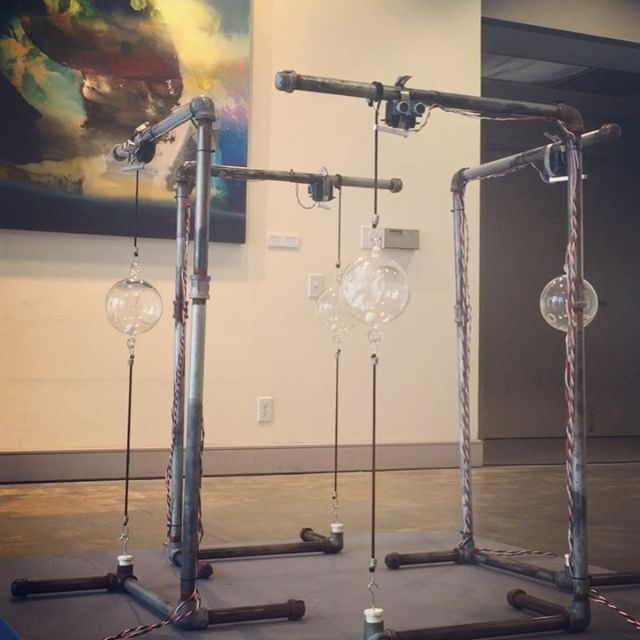
Functionally, the installation is comprised of a set of four electromechanical sculptures that operate in subsequent harmony and discord based on environmental impulses. Each sculpture, positioned at a Cardinal Direction, operates independently by way of a servomotor that strikes tensed bungee cables containing a glass orb with a glass marble. In effect, both movement and sound ensue, the latter continuously amplified by digital effects. Software manipulates and morphs the sequence at which the sculptures fire, inviting participants to meddle with the notion of direction amidst time.
The physical component of the piece serves as the starting point of the interaction model. Each sculpture contains a sonar sensor, which detects motion and proximity. The motors fire in a clockwise sequence, and the starting point of a sequence is dependent on real-time and historic data captured from each sonar sensor. When in real-time mode, the closer a participant is to a particular sculpture, the more likely it is to start a sequence from that direction. Additionally, the algorithm takes an average of all distances captured from the sonar sensors and maps it to the rest period between sequences as well as the strength of a sonic delay effect from contact microphones placed at the base of each sculpture. When more participants are present in the field of each sensor, the resulting data captured leads to more democratic effects, which toy with participants’ mental model of how the installation provides feedback. This serves as a direct analogy to the unpredictability of life and the potential impact our interactions with others may have on our sense of space and time.
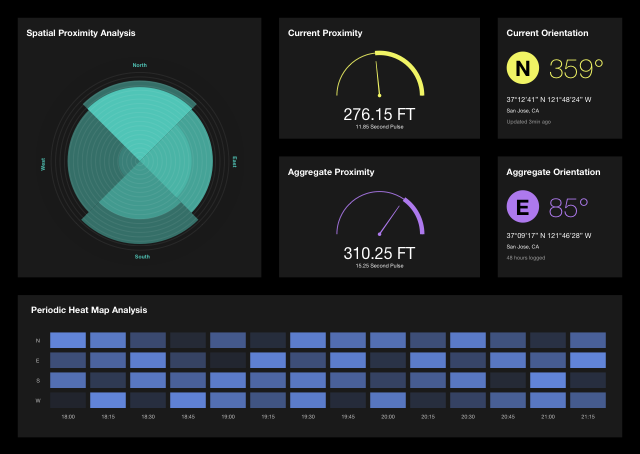
While the physicality of the work serves as a means to generate data, a digital projection placed behind the sculptures serves to visualize both real-time and historic data captured. During the course of the work’s exhibition history, proximity and motion data have been captured from the proximity sensors. This dashboard visualization entails a modular design to allow participants to glean visual insight from the installation. The visualizations include a Periodic Heat Map showing proximity strength from each cardinal direction in a set time interval (e.g., 60 sec, 10 min), a Spatial Proximity Analysis showing real-time distance metrics transposed over historic distance metrics in a polar chart, a Current Proximity Average shown as a gauge and taken from real-time sensor data, an Aggregate Proximity Average shown as a gauge and taken from real-time and historic sensor data, a Current Orientation Marker based on real-time participant input and an Aggregate Orientation Marker based on real-time and historic participant input. As a result, the installation consists of a feedback loop where the physical component serves as a means to generate data while the digital component serves as a means to visualize it.